In 2013 Bill Gates reviewed The Most Powerful Idea in the World. This passage has stuck with me ever since:
Rosen argues that only with the ability to measure incremental advances […] can you achieve sustained innovation.
Simple tools meant to observe - not intervene - stand in stark contrast to diving in head first, burning the midnight oil, and powering through to the finish line. The latter is a valid approach for many problems, but it’s a recipe for burnout with big problems.
By February 2018 it was clear our Jenkins fleet had become too complex. We had more than 30 controllers (servers) with different plugins on each. When plugins were installed on all controllers, versions often diverged creating clear problems for three audiences.
1. Security
Jenkins publishes security advisories regularly. The advisory gives a list of plugin versions that are fixed, and plugins that have not yet been fixed. The goal is to either remove or upgrade the impacted plugins.
Triaging plugin versions across so many controllers took a long time. The plugin manager page is slow to load, and it had to be done 32 times.
2. Generator Authors
Jenkins jobs were created at a blistering pace in this era. A new project generator would generate five Jenkins jobs. The promise was you’d get everything you needed from your Jenkins setup without actually having to set up Jenkins.
Plugins were configured for email notifications, test reports, code coverage, static analysis results, and more.
The generator allowed choosing any Jenkins controller as a target. Implicitly this meant it had to know which plugins were installed and how to configure all deployed versions.
If an author chose to do the research first, it was the same tedious process of loading each plugin manager page on each controller. If that was too much to bear, users would discover the oversight immediately - surely destroying their confidence in the tooling.
3. Jenkins Team
My team is responsible for keeping Jenkins up-to-date. Our confidence was on the rise as we moved from adhoc upgrades to a rollout pipeline. The pipeline still had room for improvement. Problems would manifest themselves at the end of the pipeline, after everything else had succeeded. Often the fix was to upgrade or uninstall the problematic plugin. We could tackle the risk systematically if only it were easier to tell which plugins were most varied.
There had to be a better way.
Jenkins Plugin Skew
Fortunately Jenkins had an API for this plugin version data. It was easy to make the call for each controller in the fleet. We started to do this every day, stored the results, and built this simple matrix. Jenkins Plugin Skew was born.
The tedious was now easy. Speed of triaging security advisories improved, the security folks were happy with the progress. Generator authors could now make better decisions proactively about choosing, installing, and updating plugins. For our part, we could put a number on our hunch of extreme complexity.
Even more important, we could begin to make better decisions about what to do with plugins. Installed on two controllers? Let’s try to remove it. Installed on 28 controllers with 9 different versions? Let’s start auto-upgrading it with the rollout.
A new era was here.
Supporting CSV
The matrix existed for years before it evolved to support CSV in January 2021. The best thing about supporting CSV is that it’s a high-leverage format. All the analysis tools of spreadsheets, scripting languages, and other data tools were now options.
My favorite features from this era were conditional highlighting, manual snapshotting during rollouts for comparisons, and charting.
Snapshotting
Manual snapshotting worked well, but one had to be paying close attention to make it work.
How nice would it be if we had all this data without having to think about it?
It would be trivial for us to learn and tell compelling stories about what worked and did not work.
A Jenkins job that curls our CSV endpoint daily and archives it for safe-keeping works just fine here.
We can run a script adhoc with over a year of daily data at our disposal.
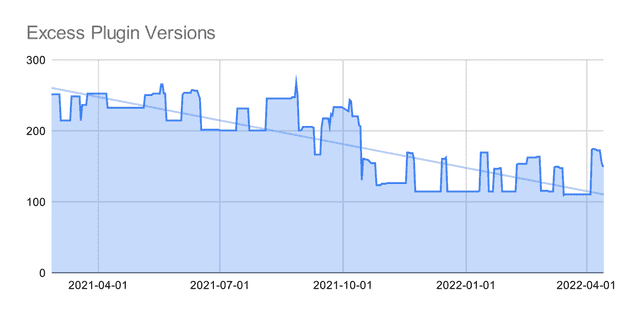
Here’s an example - a burndown chart called excess plugin versions. Ideally each installed plugin has one version across the entire Jenkins fleet. From our CSVs we can extract the total count of plugins and plugin-versions.
Excess Plugin Versions = (Plugin Count) - (Plugin-Version Count).
In the past 5 quarters we have cut excess plugin versions by half. Not bad for a background initiative.
It’s now straightforward to answer any question we may have.
- Are we removing plugins?
- Are we managing fewer versions?
- When was a plugin added?
- When was a plugin upgraded?
All thanks to simple tools.

